Updated daily except for "All Sector Indexes" (last table)
NOTE!: SOME OF THE WEEKLY MACD TABLES ARE BEING CHANGED OVER TO THE NEW FORMAT. THE EXAMPLES BELOW REFER TO THE NEW FORMAT TABLES.
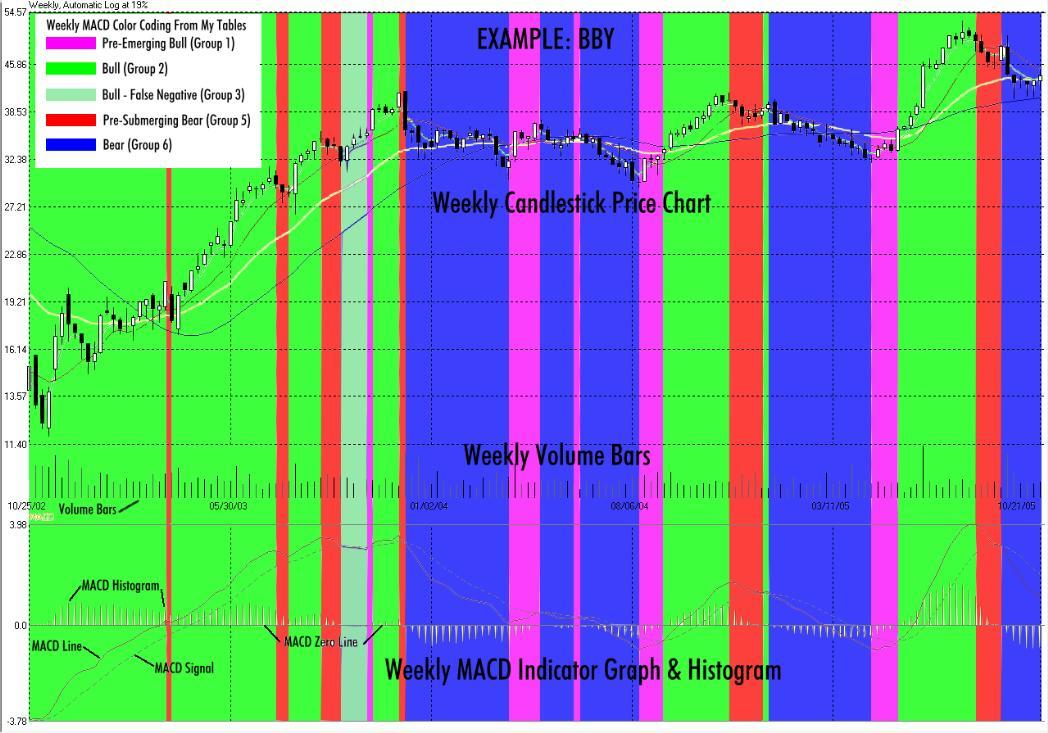
Here is a sample 3 year stock chart showing weekly price, volume and MACD trends. Colors correlate to the condition coloring in my tables:
Below are the links to my Weekly MACD trend tables, updated daily. Each table's results are colored and sorted by weekly MACD conditions. The first table rates the 250 stocks I currently follow. The last table rates 198 sectors based on all listed NYSE, NASDAQ, and AMEX stocks contained within (the only one updated weekly). The rest contain index or sector components that currently interest to me. These sectors will change from time-to-time.
Each table colors and sorts the components in that sector based on its weekly MACD condition (first two characters). It also signifies conditions of the 50 day EMA (3rd and 4th characters), 130 day EMA (5th and 6th characters) and 200 day EMA (last two characters). The daily and weekly "Weekly MACD" data cells are color coded based on the stock's "weekly MACD" condition for the column date. The list is sorted by the stock's current WEEKLY MACD condition and grouped with stocks of similar condition. All but the last table are updated daily, the last is updated weekly.
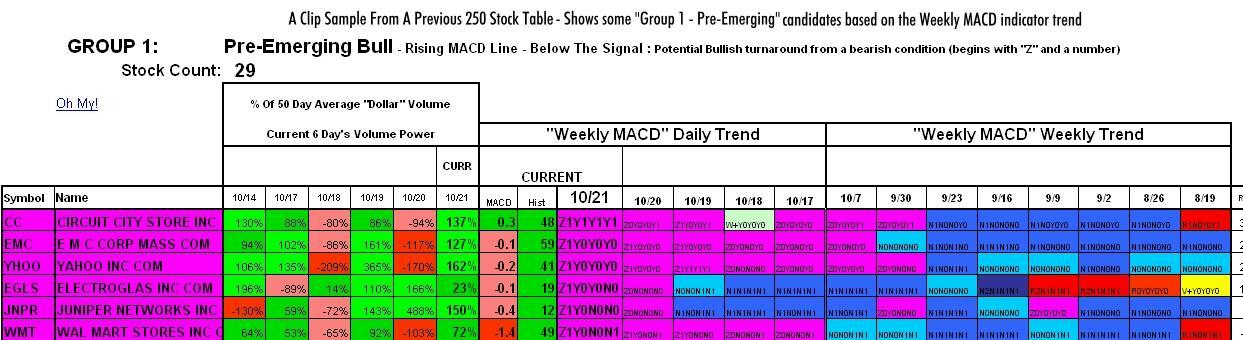
(1st Pair) The first letter/number combo and cell (shading) rates the weekly MACD condition. The number indicates the angle of ascent/decent for the weekly MACD line. A higher number indicates a more severe line, a lower number is less severe. Sorted and shaded by 7 condition groups. The beginning letter just signifies which group the stock belongs - example all beginning with "Z" (formerly "X") are "group 1 - pre-emerging bull" condition stocks.
The Moving Average Line Conditions - "Y" The stock price is above the average, "N" below the average.
(2nd Pair) The second set of letter/numbers rates the stock price-to-50 day EMA line position.
(3rd Pair) The third set of letter/numbers rates the stock price-to-130 day EMA line position.
(4th Pair) The fourth set of letter/numbers rates the stock price-to-200 day EMA line position.
The sorting strives to place the strongest positive stocks at the top of their "group" (groups 1 thru 4) and the weakest negative stocks at the top of their group (groups 5 thru 7).
The charts and tables here do not represent any recommendation from myself to buy or sell any security. I also do not guarantee the accuracy of these charts and graphs as the data is provided to me without guarantee.
I welcome and encourage feedback.